
Introduction: Looking for a Free Tableau Alternative?
Tableau is widely used for business intelligence, interactive dashboards, and data visualization. It helps organizations turn business data into visual insights that support decision-making.
However, as analytics requirements grow, businesses may start looking beyond traditional dashboarding tools. Licensing costs, deployment preferences, embedded analytics requirements, AI integration, and document reporting can all influence the decision to explore a Tableau alternative.
For example, a growing SaaS company may want to offer analytics to its customers without complicating its existing product architecture. An enterprise might need interactive dashboards alongside formatted financial statements. Another organization may want employees to ask questions about business data using AI instead of relying exclusively on manually created reports.
These requirements make choosing a business intelligence platform a broader decision than comparing chart types.
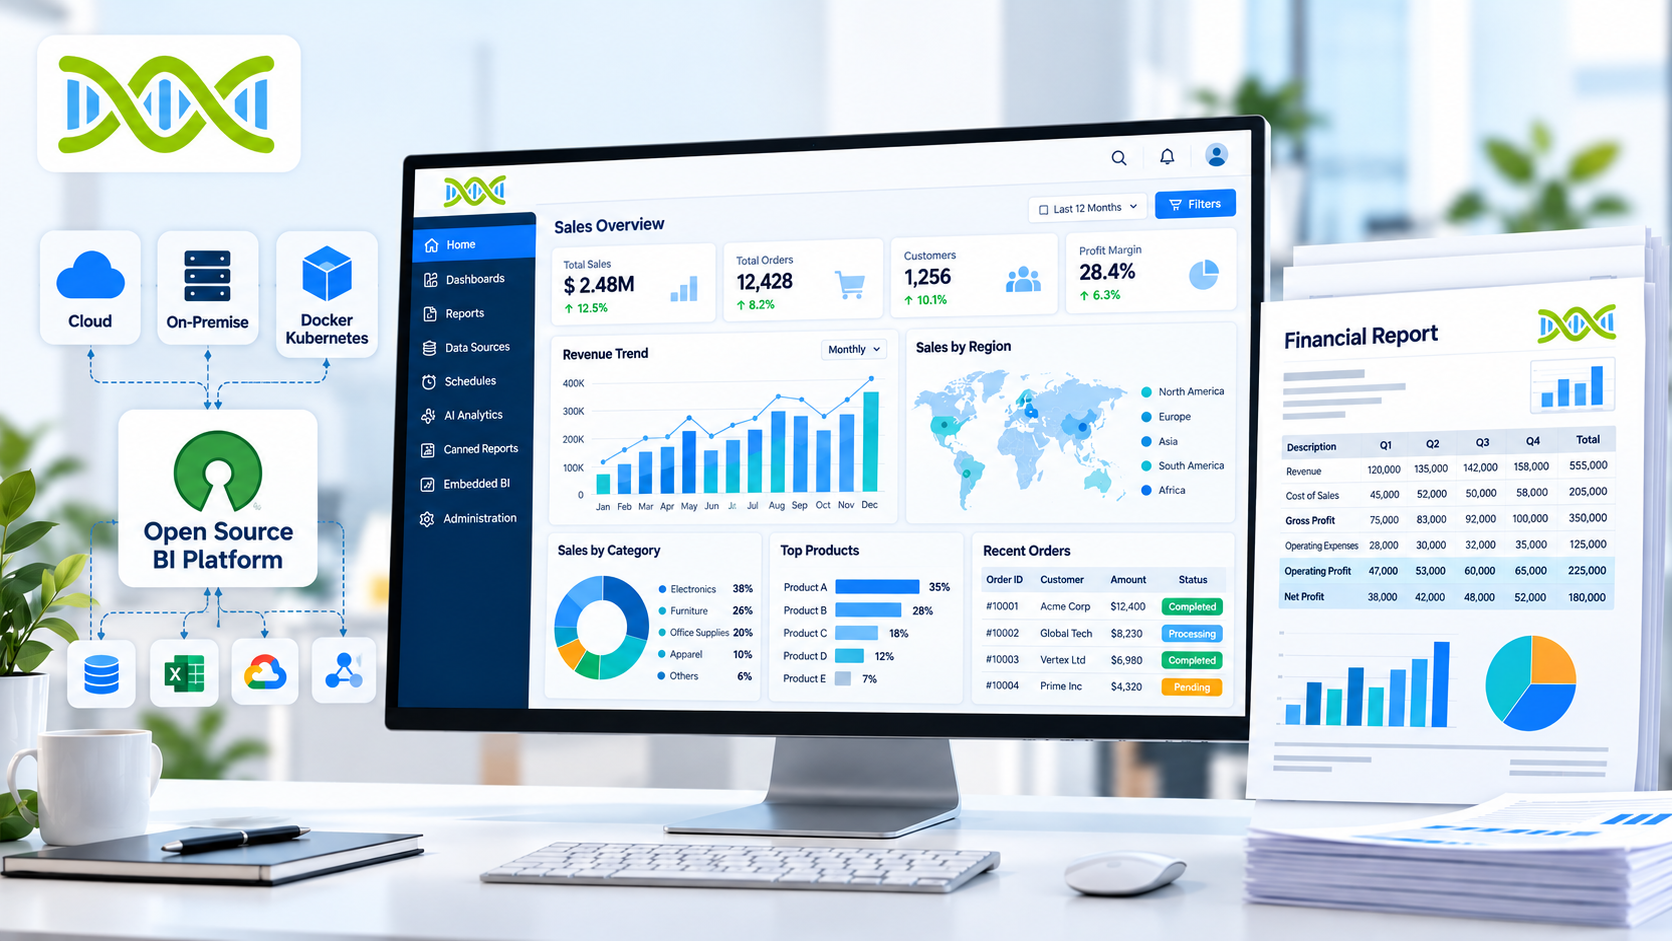
Helical Insight is a free, open-source business intelligence platform worth considering as a Tableau alternative. Developed by Helical IT Solutions, it combines interactive dashboards, self-service analytics, AI-powered conversational BI, embedded analytics, and pixel-perfect reporting within one platform.
This guide explores how Helical Insight compares with Tableau, which capabilities matter when evaluating a replacement, and how businesses can determine whether it fits their analytics requirements.
Why Are Businesses Searching for Tableau Alternatives?
Organizations consider replacing a BI platform for different reasons. The right solution depends on which limitations they are trying to address.
1. Reducing business intelligence costs
As more employees and customers need access to analytics, licensing becomes an important consideration.
Businesses should examine the complete cost of their existing BI environment, including licenses, advanced capabilities, embedding requirements, administration, and infrastructure.
Tableau offers different products and licensing arrangements, so the actual cost depends on the deployment and user requirements.
For organizations looking to reduce software licensing expenditure, a free, open-source BI platform can provide another option to evaluate.
Helical Insight offers a free, open-source Community Edition. Its published product information describes the full feature set as available in that edition, with commercial support and branding being principal differences from the Enterprise Edition. Organizations should confirm current licensing and usage terms before deployment.
2. Getting more from business data
A dashboard can show that revenue has declined, but managers often need to investigate why.
They may want to filter by region, compare product categories, examine historical trends, and identify the factors contributing to the change.
A Tableau alternative should support the analytical interactions users need, including filtering, drill-down, detailed reports, and flexible visualizations.
Helical Insight supports interactive dashboard workflows that can be evaluated against these requirements.
3. Introducing AI-powered analytics
Businesses increasingly want to make data exploration accessible to users who do not write SQL or build reports regularly.
Conversational analytics provides another way to interact with business data by allowing users to submit questions in natural language.
Helical Insight offers Instant BI, an AI-powered module for conversational analysis of connected data, with support for supported language-model integrations.
4. Supporting different reporting formats
Interactive dashboards are not always sufficient for operational and financial reporting.
Organizations may also need invoices, purchase orders, account statements, and multi-page reports with consistent formatting.
When choosing a Tableau alternative, businesses should determine whether these requirements can be met within the selected platform or require additional reporting software.
Helical Insight includes a dedicated Canned Reporting module for formatted, multi-page business documents.
5. Embedding analytics into applications
SaaS companies and software developers may want to display dashboards directly within their own products.
This introduces requirements involving APIs, authentication, customization, permissions, and customer-specific data access.
Helical Insight provides embedded analytics and API capabilities that organizations can evaluate for these use cases.
What Makes Helical Insight a Tableau Alternative Worth Evaluating?
Helical Insight approaches business intelligence as a combination of data exploration, reporting, integration, and analytics delivery.
Rather than focusing only on dashboard creation, the platform provides capabilities across several common BI requirements.
| Business requirement | Helical Insight capability |
|---|---|
| Interactive dashboards | Charts, tables, KPIs, and dashboard filters |
| Self-service analytics | Visual report and dashboard creation |
| Detailed data investigation | Drill-down, drill-through, and filtering workflows |
| AI-assisted analysis | Instant BI with supported LLM integrations |
| Embedded business intelligence | Embedding and APIs |
| Structured business documents | Pixel-perfect Canned Reporting |
| Report distribution | Supported exporting, scheduling, and delivery workflows |
| Deployment flexibility | Supported self-hosted and other deployment options |
| Access management | Configurable permissions and supported data-access controls |
The availability and behavior of specific features depend on the product version and configuration. Businesses should validate the capabilities they need with a representative proof of concept.
Helical Insight vs. Tableau: A Practical Comparison
Choosing between Helical Insight and Tableau requires looking at how each platform supports the organization’s existing workflows.
| Evaluation criterion | Tableau | Helical Insight |
|---|---|---|
| Primary focus | Visual analytics and business intelligence | Business intelligence, reporting, and embedded analytics |
| Interactive dashboards | Yes | Yes |
| Data visualization | Extensive visualization capabilities | Interactive visualizations and configurable dashboards |
| Self-service analysis | Supported | Supported |
| AI-powered analytics | Capabilities depend on the Tableau product and configuration | Instant BI with supported LLM integrations |
| Embedded analytics | Available through relevant offerings | Embedded BI and APIs |
| Pixel-perfect document reporting | Assess specific requirements and available reporting components | Dedicated Canned Reporting module |
| Open-source Community Edition | No | Yes |
| Self-hosted deployment | Options depend on the Tableau product | Supported self-hosted deployment options |
| Migration | Existing Tableau environment | Migration utilities offered by the Helical Insight team |
This comparison is intended to support initial evaluation rather than suggest that the two products have identical interfaces or functionality.
Tableau may remain appropriate for organizations that depend on its particular visualization workflows and existing ecosystem. Helical Insight is worth evaluating when open-source availability, AI integrations, embedded analytics, and dedicated document reporting are important requirements.
1. Interactive Dashboards for Business Performance Monitoring
Dashboards help organizations monitor business performance without reviewing multiple disconnected reports.
Helical Insight supports dashboards that combine charts, tables, filters, and other report elements to present relevant information in one workspace.
Consider a company tracking sales across several regions. Its dashboard could display:
- Total sales and revenue trends.
- Regional performance comparisons.
- Product-category revenue.
- Monthly sales growth.
- Customer and order metrics.
When a manager notices a decline, interactive filters and drill-down workflows can help investigate the relevant regions, products, or time periods.
This approach makes dashboards useful not only for monitoring KPIs but also for exploring the data behind them.
For businesses moving from Tableau, the important step is to test their existing calculations, visualizations, and dashboard interactions rather than assuming that every workbook will behave identically after migration.
2. AI-Powered BI With Instant BI and Bring Your Own LLM
AI is changing how users discover information in business intelligence platforms.
Instead of navigating every dashboard manually, a user may want to ask a question such as:
- Which products generated the most revenue last quarter?
- Which regions experienced declining sales?
- How did this month’s performance compare with the previous month?
- Which customer segments contributed most to revenue growth?
Helical Insight provides Instant BI for conversational analytics on connected business data.
Why Bring Your Own LLM matters
The Bring Your Own LLM approach allows organizations to evaluate supported language models according to their technology requirements.
This can be useful for businesses that want to consider different AI providers, hosting approaches, costs, and governance requirements.
For example, an organization may want to evaluate whether its chosen supported model can answer common business questions accurately while operating within its security requirements.
Actual results depend on the model, data configuration, and integration. Organizations should validate calculations, permissions, and sensitive-data handling before using AI analytics in production.
For companies searching for an AI-powered Tableau alternative, this is an important capability to include in the evaluation.
3. Pixel-Perfect Reporting for Business Documents
One difference worth examining when comparing BI platforms is the ability to produce formal, multi-page documents.
Interactive dashboards are designed for exploration. Business documents often require controlled layouts, repeating headers, page breaks, tables, totals, and consistent formatting.
Common examples include:
- Invoices and purchase orders.
- Financial statements.
- Bank and account statements.
- Salary slips.
- Compliance documents.
- Detailed operational reports.
Helical Insight includes a Canned Reporting module designed for formatted, multi-page reporting.
Its report designer supports document elements such as tables, headers, footers, calculations, and images.
For organizations that require both interactive analytics and formal business reporting, this capability may reduce the need to maintain separate reporting products.
The best way to assess it is to test actual documents and verify pagination, formatting, calculations, and required export formats.
4. Embedded Analytics for SaaS Businesses
A Tableau alternative should also be assessed for how well it supports analytics outside the BI application itself.
SaaS businesses often want to make analytics part of their product experience.
For example, a CRM vendor may want to provide customer performance dashboards, while an inventory management company may need stock and sales analytics within its application.
Helical Insight offers embedded analytics and APIs that can be evaluated for such implementations.
Relevant use cases include:
- Embedding dashboards in SaaS applications.
- Providing analytics through customer portals.
- Integrating reports into enterprise software.
- Customizing the analytics experience.
- Supporting multi-tenant application architectures.
Security is particularly important in embedded BI. Organizations must verify authentication, authorization, tenant isolation, and data-access rules for their specific architecture.
Before selecting any platform for customer-facing analytics, validate the required integrations and applicable licensing terms.
5. Self-Service Analytics for Non-Technical Users
Business users often need answers faster than a central analytics team can deliver them.
A self-service BI platform gives users ways to explore approved data through visual reporting interfaces, filters, and dashboards.
Helical Insight supports visual report creation and interactive analysis workflows.
For example, a sales manager could filter monthly revenue by region, investigate product performance, and open a detailed report to examine specific business results.
The objective is to reduce dependency on technical teams for routine analysis while preserving consistent definitions and appropriate access controls.
When evaluating a replacement for Tableau, test common user tasks with employees who will use the platform regularly. Ease of use should be measured through actual workflows rather than interface appearance alone.
6. Tableau Migration: What Should You Evaluate?
Migrating from Tableau to another BI platform requires more than recreating dashboards.
Existing workbooks may include custom calculations, filters, data relationships, security settings, and integrations that are important to business operations.
Helical Insight’s team offers automated utilities intended to assist with Tableau-to-Helical Insight migration and reduce repetitive manual work.
The applicable automation and migration effort depend on the source environment and the components involved.
A structured migration process should include:
- Inventory existing Tableau workbooks and dashboards.
- Identify data sources, custom SQL, and calculated fields.
- Document filters, hierarchies, and drill-down workflows.
- Review permissions, security rules, and scheduled reports.
- Identify embedded dashboards and application integrations.
- Test migration utilities with representative assets.
- Validate calculations, data accuracy, exports, and user interactions.
- Estimate the effort required for components that need manual adjustment.
Start with a pilot involving both simple and complex reports. This helps identify compatibility issues before planning a broader migration.
Organizations should contact the Helical Insight team to establish which migration utilities are applicable to their Tableau environment.
7. Why Consider a Unified BI Platform?
Many organizations add reporting tools as new requirements emerge.
A business might start with dashboards, add formal reporting, introduce embedded analytics, and later explore AI-powered data analysis.
When these capabilities are spread across several products, teams may need to manage separate integrations, permissions, upgrades, and administrative processes.
Helical Insight brings several of these capabilities together within one BI platform.
This may be relevant to organizations that need dashboards, conversational analytics, application integration, and formatted reporting within a shared environment.
However, a unified platform does not automatically eliminate all integration or maintenance work. The actual benefits depend on the existing technology stack and the complexity of the deployment.
Is Helical Insight the Right Free Tableau Alternative for You?
Helical Insight is worth considering if your organization wants to evaluate a free, open-source BI platform with dashboards, self-service analytics, AI-assisted analysis, embedded BI, and pixel-perfect reporting.
It may be particularly relevant for:
Organizations managing BI costs: Evaluate the Community Edition against your licensing and operational requirements.
SaaS businesses: Explore embedded analytics, APIs, customization, and tenant-specific access.
Enterprises with document reporting needs: Test the Canned Reporting module using actual business documents.
Teams exploring AI: Evaluate Instant BI with supported language models and verified business questions.
Organizations planning Tableau migration: Assess existing dashboards and migration utilities through a structured pilot.
The platform may not be the best fit for every environment. If your organization depends on specialized Tableau features or complex existing workbooks, compare the products using a detailed requirements checklist before deciding.
Frequently Asked Questions
What is the best free Tableau alternative in 2026?
Helical Insight is one option worth evaluating for organizations seeking a free, open-source BI platform with interactive dashboards, self-service analytics, AI-powered conversational BI, embedded analytics, and pixel-perfect reporting. The best choice depends on your specific requirements.
Is Helical Insight a free Tableau alternative?
Helical Insight offers a free, open-source Community Edition. Its published product information describes the full feature set as available in this edition, with commercial support and branding being principal differences from the Enterprise Edition. Review current licensing terms before adoption.
Does Helical Insight provide the same features as Tableau?
The platforms support several overlapping BI workflows, including interactive dashboards, filtering, and visual analytics. Their interfaces and implementation details differ, so organizations should test the specific features and calculations their users depend on.
Can Helical Insight replace Tableau for enterprise reporting?
It may be suitable for enterprises that need interactive analytics alongside structured business reporting. A proof of concept should validate data connections, calculations, security, performance, document output, and migration requirements.
Does Helical Insight support AI analytics?
Yes. Instant BI supports conversational analytics using connected business data and supported LLM integrations. The accuracy and security of results depend on the selected configuration and underlying data.
Can I migrate my Tableau dashboards to Helical Insight?
Migration can be planned around existing workbooks, calculations, data sources, and dashboard interactions. Helical Insight’s team offers automated migration utilities intended to reduce manual effort, but compatibility should be verified with representative reports.
Is Helical Insight suitable for embedded BI?
Helical Insight provides embedded analytics and APIs that organizations can evaluate for SaaS applications, customer portals, and internal business systems. Authentication, permissions, tenant isolation, and licensing should be validated for the intended use.
Does Helical Insight support pixel-perfect reporting?
Yes. Its Canned Reporting module is designed for formatted, multi-page documents such as financial statements, invoices, and operational reports.
Conclusion: Explore a Free Tableau Alternative Built for Broader BI Requirements
Finding the right Tableau alternative requires evaluating more than visualization features. Organizations should consider software costs, self-service analytics, AI integration, embedded applications, document reporting, deployment flexibility, and migration effort.
Helical Insight brings these capabilities together through interactive dashboards, Instant BI with supported LLM integrations, embedded analytics, and a dedicated Canned Reporting module.
For organizations seeking a free, open-source Tableau alternative, it offers an option to assess against real business requirements rather than relying solely on feature comparisons.
Start by testing representative dashboards, reports, and AI queries to determine whether the platform meets your needs.
Explore Helical Insight: https://www.helicalinsight.com/
Planning a Tableau migration? Contact the Helical Insight team to discuss your existing environment, reporting requirements, and the applicability of available migration utilities.
Helical Insight — Open-source business intelligence for interactive dashboards, AI-assisted analytics, embedded BI, and pixel-perfect reporting.